Built by you, in minutes
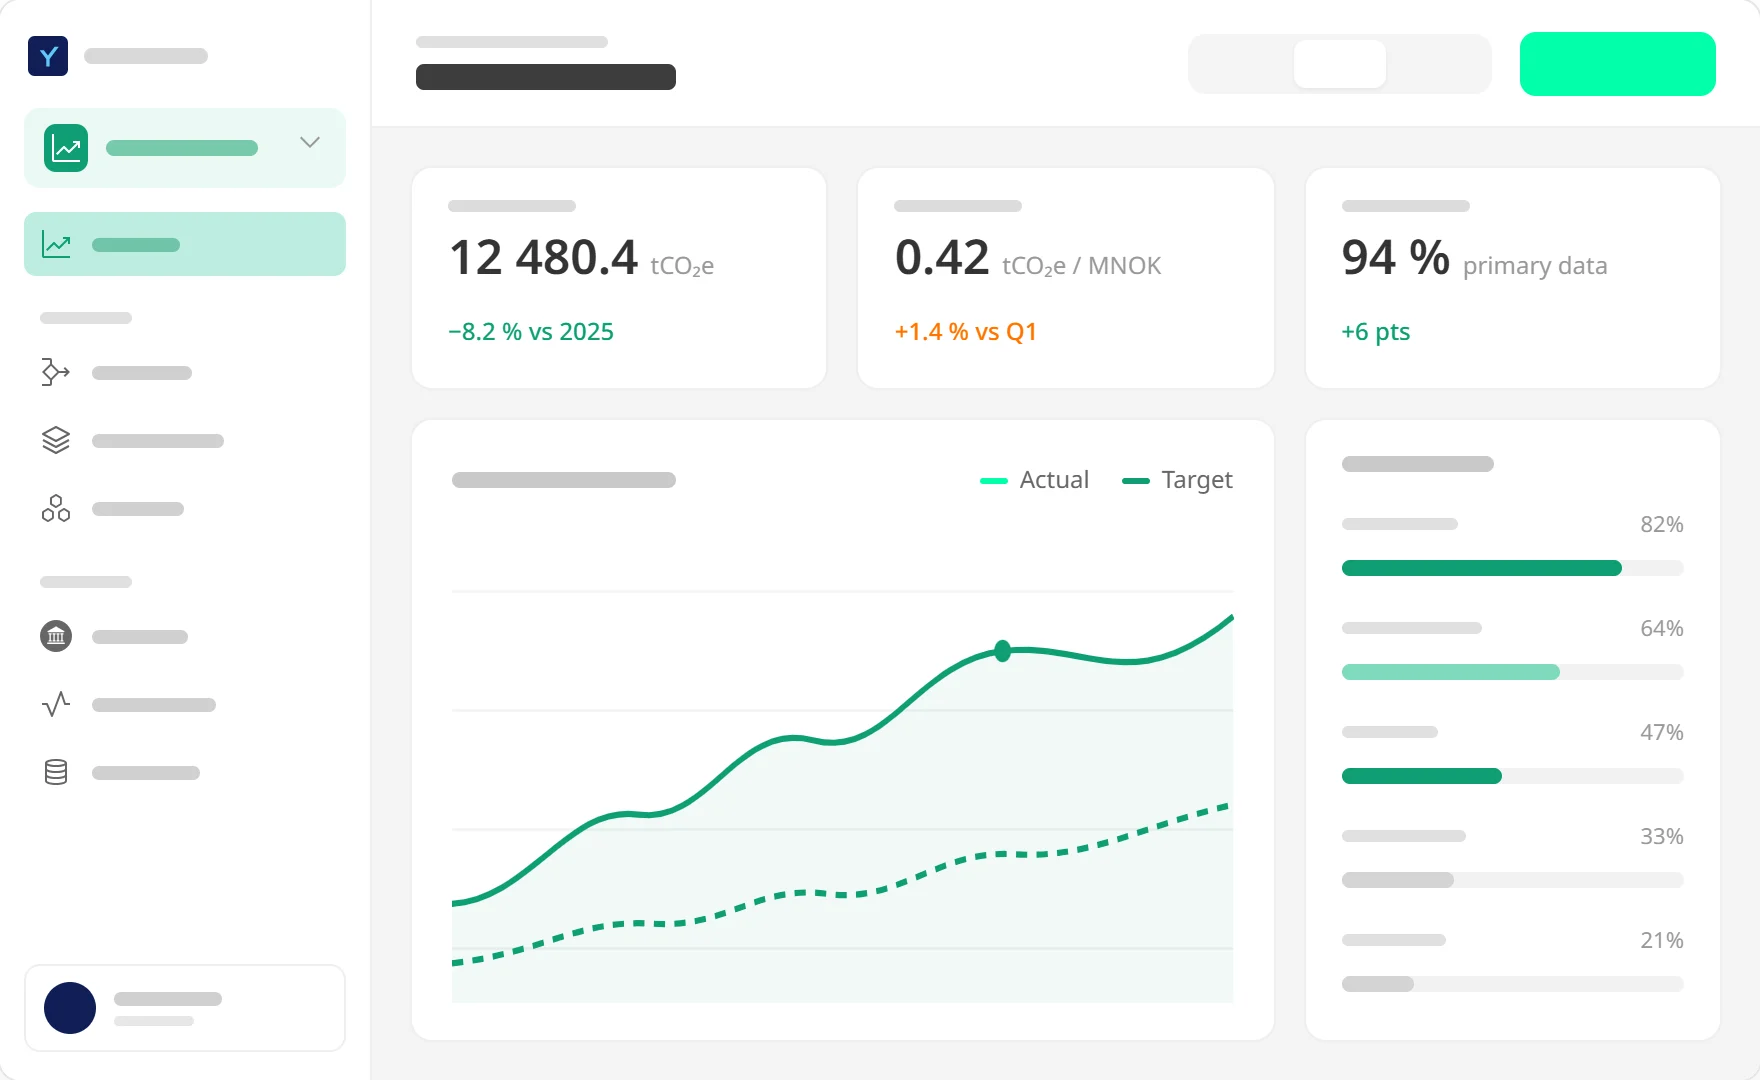
Pick your data, choose how to summarise it and how to show it. Arrange panels into sections and adjust them whenever your needs change. No code, no report requests.

Dashboards you build yourself, on data that's always current.
Every business measures different things. Insights lets you build the dashboards you need, without waiting for a BI team or exporting data to another tool. Because your data already flows into Vyer.eco, your dashboards are live from the start.
Pick your data, choose how to summarise it and how to show it. Arrange panels into sections and adjust them whenever your needs change. No code, no report requests.
Dashboards read directly from the data your flows collect. When new data arrives, your numbers update. No copying data into spreadsheets or separate BI tools.
Line and bar charts, pie charts, key figures, gauges, tables, heat maps and maps. Show a trend, a total or a location, depending on what the number needs to say.
Track how your flows are running: how many runs, what succeeded and what needs attention. Operations and data in the same place.
Insights works on the same data as Automation Studio and Carbon accounting. Everything your flows collect is ready to use on a dashboard.
Put meter readings and sensor data next to invoices, orders and CRM records on the same dashboard. Follow energy use and production volume, or emissions and revenue, in one view without stitching tools together.